
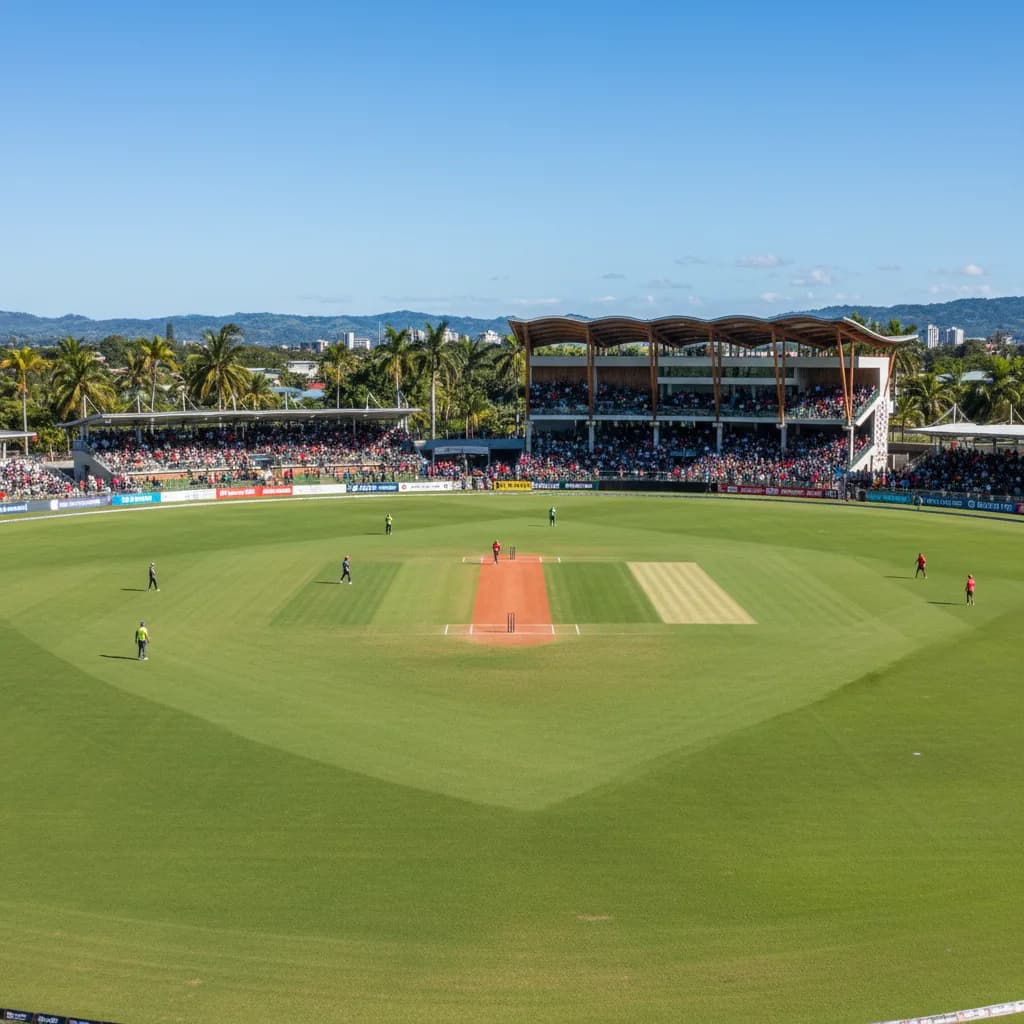
Amini Park, Port Moresby Pitch Report
Port Moresby,
Pitch Overview
32
Total Matches
148
Avg 1st Innings
N/A
Avg Wickets/Match
Low-scoring
Pitch Character
Average Scores by Format
ODI
Matches played13
Avg 1st innings score195
Avg 2nd innings score134
Highest total284
Lowest total33
Bat first win %75.0%
Chase win %25.0%
T20
Matches played19
Avg 1st innings score116
Avg 2nd innings score90
Highest total229
Lowest total12
Bat first win %50.0%
Chase win %50.0%
Toss Statistics
The toss winner has gone on to win the match in 46.9% of games at Amini Park, Port Moresby.
| Format | Matches | Chose Bat | Chose Field | Toss Winner Won |
|---|---|---|---|---|
| T20 | 19 | 15 (79%) | 4 (21%) | 8 (42%) |
| ODI | 13 | 6 (46%) | 7 (54%) | 7 (54%) |
First Innings Score Distribution
ODI
150-2498 (62%)
250-3492 (15%)
Under 1503 (23%)
T20
150-2492 (11%)
Under 15017 (89%)
Scoring Trends by Season
| Season | Format | Matches | Avg 1st Innings |
|---|---|---|---|
| 2026 | ODI | 3 | 183 |
| 2026 | T20 | 2 | 98 |
| 2025/26 | ODI | 4 | 160 |
| 2025 | T20 | 6 | 103 |
| 2023 | T20 | 11 | 127 |
| 2022 | ODI | 6 | 224 |
Betting Insight
Run Lines: With an average first innings score of 148 across all formats, this is a low-scoring venue. Under lines and bowler markets offer good value.
Please gamble responsibly. 18+. BeGambleAware.org