
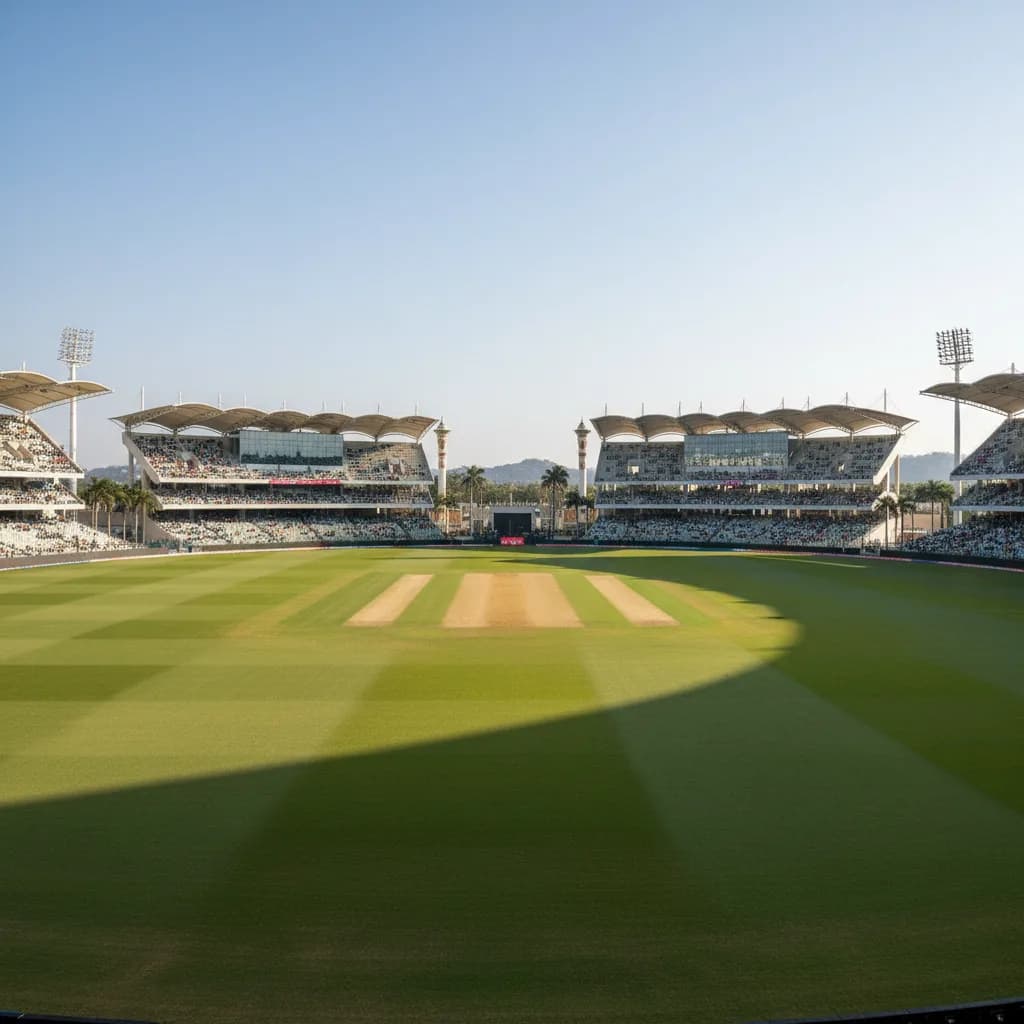
Maharaja Yadavindra Singh International Cricket Stadium, New Chandigarh Pitch Report
New Chandigarh,
Pitch Overview
11
Total Matches
244
Avg 1st Innings
N/A
Avg Wickets/Match
Balanced
Pitch Character
Average Scores by Format
ODI
T20
Toss Statistics
The toss winner has gone on to win the match in 36.4% of games at Maharaja Yadavindra Singh International Cricket Stadium, New Chandigarh.
| Format | Matches | Chose Bat | Chose Field | Toss Winner Won |
|---|---|---|---|---|
| T20 | 8 | 2 (25%) | 6 (75%) | 4 (50%) |
| ODI | 3 | 2 (67%) | 1 (33%) | 0 (0%) |
First Innings Score Distribution
ODI
T20
Scoring Trends by Season
| Season | Format | Matches | Avg 1st Innings |
|---|---|---|---|
| 2026 | T20 | 6 | 219 |
| 2025/26 | ODI | 2 | 287 |
Betting Insight
Run Lines: With an average first innings score of 244 across all formats, this ground produces balanced contests. Look for value in match-specific conditions.
Please gamble responsibly. 18+. BeGambleAware.org
Recent Results at Maharaja Yadavindra Singh International Cricket Stadium, New Chandigarh
India vs West Indies
351/7 / 352/5
West Indies won
Rajasthan Royals vs Gujarat Titans
214/6 / 219/3
Gujarat Titans won
Rajasthan Royals vs Sunrisers Hyderabad
243/8 / 196/10
Rajasthan Royals won
Punjab Kings vs Rajasthan Royals
222/4 / 228/4
Rajasthan Royals won
Punjab Kings vs Lucknow Super Giants
254/7 / 200/5
Punjab Kings won